GEN 3 Services
GEN 3.2 Aeronautical charts
| 1. Responsible dependency | |||||||||||||||
| The Civil Aviation Authority has available in the Aeronautical Publications and Cartography office, several aeronautical charts for use by civil aviation in general. The Aeronautical Cartography process is in charge of producing the charts that are part of the AIP. | |||||||||||||||
| The Aeronautical Navigation Chart, scale 1:500.000 is produced by the Civil Aviation Authority and the National Geographic Institute, located at “Registro Nacional”. | |||||||||||||||
| The charts are produced in accordance with the procedures contained in the RAC-04 Regulation of Aeronautical Charts. Differences with these procedures are detailed in subsection GEN 1.7. | |||||||||||||||
| 2. Maintenance of charts | |||||||||||||||
| 2.1 The aeronautical charts included in the AIP are usually kept up to date or substitute by amendments to the AIP. The important amendments or reviews of aeronautical information to other aeronautical chart series are also included in the AIP and could be promulgated by SUPPLEMENTS, if requires. The information concerning new maps and charts would be notified by Aeronautical Information Circular (AIC) or SUPPLEMENTS, as requires. | |||||||||||||||
| 2.2 If information datum that after the publication were incorrect, will be corrected by NOTAM IF IS OF OPERATIONAL SIGNIFICANCE, centering the attention in the corresponding chart. | |||||||||||||||
| 2.3 Aeronautical information in all charts are usually review and new editions are published and amended as usual as the production resources affords. | |||||||||||||||
| 3. Purchase arrangements | |||||||||||||||
| 3.1 The charts as listed under GEN 3.2-2 may be obtained on request from the: | |||||||||||||||
|
Civil Aviation Authority
Aeronautical Cartography and Publications Office Radar Control Building P.O. Box 5026-1000 San José, Costa Rica, C.A. Email: aiscr@dgac.go.cr | |||||||||||||||
|
3.2 Aeronautical Chart
scale 1:500.000 may be obtained on National Geographical Institute located at “Registro
Nacional”.
( See GEN 3.2-9 ) | |||||||||||||||
| 4. Aeronautical chart series available | |||||||||||||||
| 4.1 The following series of aeronautical charts are produced: | |||||||||||||||
|
Aeronautical Chart scale
1:500.000 (ANC/500)
Instrument Approach Chart, of Juan Santamaria International Airport and Daniel Oduber Quiros International Airport, Limón International (IAC) Aerodrome Obstacle Chart - TYPE A. (AOC) Area Chart of Juan Santamaría Airport and Daniel Oduber Quirós Airport (ARC) Juan Santamaría International Airport and Daniel Oduber Quirós Airport Standard Departure Chart– Instrument, (SID) Instrument Standard Arrival Chart- of Juan Santamaría International Airport, Daniel Oduber Quirós Airport (STAR) Aerodrome’s Chart, Juan Santamaría Airport, Tobías Bolaños Airport and Daniel Oduber Quirós Airport (ADC) Parking and docking of Aircraft Chart (APC) Visual Approach Chart-OACI, Juan Santamaría, Tobías Bolaños and Daniel Oduber International Airports Traffic Patterns Chart of Juan Santamaría, Tobías Bolaños, Daniel Oduber and Limon International Airports Fuel Unloading Zone Chart of Juan Santamaría and Daniel Oduber International Airport En route Chart (ENRC) Air Traffic Services Airspace Chart Air Traffic Services Classification and Airspace Distribution Prohibited, Restricted and Danger Chart Training Zones Chart. Radio Facilities – Index Chart Aerodrome and Heliports Index- Chart ATC Surveillance Minimum Altitude Chart Graphic Representation of Radar/SSR Coverage Zone Chart Aeronautical Chart-Index 1:500.000 CTR PAVAS Chart/CTR EL COCO/CTR LIBERIA Chart ATZ PAVAS Chart Cyrus Visual Procedure MROC/MRPV Currently available charts are listed on page GEN 3.2-5. La Palma Arrival Visual Chart, Tobias Bolaños International Airport Visual Corridors Chart TMA del Coco West sector Declared Distances Chart | |||||||||||||||
| Currently available charts are listed on page GEN 3.2-5. | |||||||||||||||
| 4.2 Charts description | |||||||||||||||
| Aeronautical Chart scale 1:500.000 | |||||||||||||||
| Show aerodromes available in the country, obstacles, elements of the ATS system, prohibited areas, restricted and dangerous and radio navigation aids. The chart provides information to meet the visual navigation. It is prepared by the National Geographic Institute and Civil Aviation Authority. | |||||||||||||||
| Instrument Approach Chart | |||||||||||||||
| Instrument Approach Charts follows the specifications of RAC-04 and are available in Juan Santamaría, Daniel Oduber Quirós and Limón International Airports, qualified by International Civil Aviation, where instrument approach procedures have been established. A separate Instrument Approach Chart is provided for each approach procedure at the aerodrome, these can be obtained individually. | |||||||||||||||
| Aerodrome Obstacle Chart Type A | |||||||||||||||
| The aerodrome obstacle chart Type A contains detailed information on obstacles in the take-off flight path areas of the aerodrome (operating limitations) it is available in Juan Santamaria Airport. | |||||||||||||||
| Area Chart | |||||||||||||||
| This chart provides the flight crew the information that will facilitate the phases of instrument flight. The aeronautical data include all aerodromes affected by prohibited, restricted and danger areas and the air traffic services system in detail. Contain arrival, departure and transit routes. | |||||||||||||||
| Standard Departure Chart- Instrument (SID) | |||||||||||||||
| This chart is produced whenever an instrument standard departure route- has been established. In our country this one is produced in Juan Santamaria and Daniel Oduber Quiros airports. | |||||||||||||||
| Standard Arrival Chart – Instrument (STAR) | |||||||||||||||
| Is produced whenever an instrument standard arrival route- have been established, and cannot be shown with sufficient clarity on the Area Chart, in our country this one is produced in Juan Santamaria and Daniel Oduber Quirós International Airports. | |||||||||||||||
| Aerodrome Chart: | |||||||||||||||
| This chart contains airports data to provide the flight crew information that will facilitate the ground movement of the aircraft. | |||||||||||||||
|
Parking and Docking of Aircraft Chart
This supplemental chart will provide flight crews with detailed information to facilitate the movement of aircraft on the ground between taxiways and aircraft parking bays and aircraft parking and docking. | |||||||||||||||
| Visual Approach Chart | |||||||||||||||
| This chart provides the flight crew with information that will allow them to pass from en-route flight phase and descend to the approach phase until the landing intended runway by visual reference. | |||||||||||||||
| It is available in Juan Santamaria, Tobias Bolaños and Daniel Oduber International Airports. | |||||||||||||||
| Traffic Patterns Chart | |||||||||||||||
| This chart shows the procedures to follow in the different approach portions. It is available in Juan Santamaria, Tobias Bolaños, Daniel Oduber and Limón International Airports. | |||||||||||||||
| Fuel Dumping Zone Chart | |||||||||||||||
| This chart shows the procedures to follow in case of Aircrafts Emergency. It is available in Juan Santamaria and Daniel Oduber International Airports. | |||||||||||||||
| En-route Chart | |||||||||||||||
| This chart provides the flight crew with information that will facilitate the navigation along ATS routes in compliance with air traffic services procedures. | |||||||||||||||
| Airspace classification of Air Traffic Services Chart | |||||||||||||||
| In this chart we found the lateral and vertical limits of COCO TMA and Liberia TMA and Units that provides the services, as well as frequencies. | |||||||||||||||
| Airspace Classification and Distribution of Air Traffic Services Chart | |||||||||||||||
| This chart provides lateral and vertical limits of COCO TMA and Liberia TMA. As well as the different air traffic classifications of national territory and also the Units that provides the services and their frequencies. | |||||||||||||||
| Prohibited, Restricted and Danger Areas Chart | |||||||||||||||
| This chart provides lateral and vertical limits of prohibited, restricted and danger areas of Costa Rica. | |||||||||||||||
| Training Zones Chart. | |||||||||||||||
| This chart must provide bearings, altitudes, headings to aircraft on training operations. | |||||||||||||||
| Radio facilities Chart | |||||||||||||||
| This chart is prepared as air navigation aid and show on it, all type of radio electric facilities. | |||||||||||||||
| Index Chart of aerodromes/heliports | |||||||||||||||
| This chart is published to show all aerodromes that are in the country. | |||||||||||||||
| Graphic Portrayal of Radar Coverage Zone/SRR | |||||||||||||||
| This chart is prepared to indicate the coverage of Radar Service. | |||||||||||||||
|
ATC Surveillance Minimum Altitude Chart
This letter provides the flight crew with information that allows them to monitor and verify the altitudes assigned by a controller using an ATS surveillance system. | |||||||||||||||
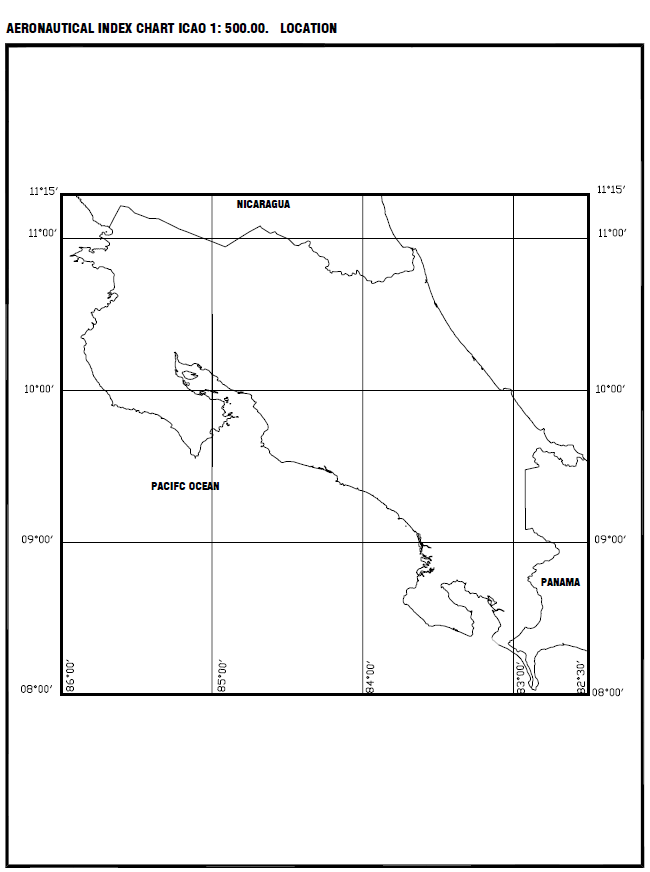
| Index of Aeronautical Chart 1:500.000 | |||||||||||||||
| This chart is used to indicate the cover and disposition of chart sheets. | |||||||||||||||
| Pavas CTR/COCO CTR/Liberia Chart | |||||||||||||||
| This chart is prepared to delimitate the air traffic control area from and to Tobias Bolaños International Airport, it is available also in Juan Santamaría and Daniel Oduber Quirós International Airports. | |||||||||||||||
| Aerodrome Traffic Zone Chart | |||||||||||||||
| This chart is used to define the traffic patterns of the aircrafts, besides marking the interceptions and departs of this pattern. It is available in Tobias Bolaños International Airport. | |||||||||||||||
| 5. List of aeronautical charts available | |||||||||||||||
| The series of charts check by an asterisk are part of the AIP | |||||||||||||||
|
Title of series |
Scale |
Name and/or number |
Price ($) |
Date |
| VFR Aeronautical Chart |
1:500.000
| Aeronautical Chart of Costa Rica | $10,00 | --- |
| 1:500.00 Index Chart ICAO | Not to scale |
GEN_3_ACI
| 18MAY23 | |
|
Radar Coverage Chart
| 1:5.500.000 | ENR_1_RCAC | 18MAY23 | |
| ATC Minimum Surveillance Altitudes Chart |
Graphic 1:825.000 |
Juan Santamarìa
Intl.
MR_ENR_1_ATCSMAC_A Daniel Oduber Intl. AD-2.MRLB MVASC |
18MAY23 18MAY23 | |
| Input and output Flows | 1:2.350.000 | ENR_1_ATFC | 18MAY23 | |
|
Visual Helipatterns
| 1:260.000 | ENR_3_VFRHRC | 18MAY23 | |
|
Distribution of Main Volcanos of Costa Rica
chart
| 1:800.000 | ENR_5_VOLCANOS | 18MAY23 | |
|
Operation Zone of Manned Balloons chart
| Graphic | ENR_5_MBOAC | 18MAY23 | |
| Garabito Paragliding Operation Zone | 1:80:000 | ENR_5_POA GARABITO | 18MAY23 | |
|
En Route chart
| 1:2.350.000 | ENR_6_EC | 18MAY23 | |
|
Area chart
| 1:2.350.000 | ENR_6_AC | 30OCT25 | |
|
Prohibited, Restricted and Danger Zones
Index Chart
| 1:2.000.000 | ENR_6_RDPIAC | 26DEC24 | |
|
Murciélago Restricted Zone Chart, MRR-1
| 1:80.000 | ENR_6_RA_MURCIELAGO | 18MAY23 | |
| Paso de La Palma Restricted Zone Chart, MRR-2 | Graphic | ENR_6_RA LA PALMA VISUAL PASS | 18MAY23 | |
|
Government Buildings Restricted Zone, MRR-3
| 1:25.000 | ENR_6_RA_GOV BUILDINGS | 18MAY23 | |
| Arsenal Nacional Restricted Zone, MRR-4 | 1:3.000 | ENR_6_RA_ARSENAL NACIONAL | 26DEC24 | |
| Caldera Restricted Zone, MRR-5 | 1:10.000 | ENR_6_RA_CALDERA | 26DEC24 | |
| Arenal Volcano Prohibited Zone Chart, MRP-1 | Graphic | ENR_6_PA_ARENAL VOLCANO | 18MAY23 | |
| La Reforma Prohibited Zone Chart, MRP-2 | Not to scale | ENR_6_PA_LA REFORMA | 18MAY23 | |
| Moìn Prohibited Zone, MRP-3 | 1:25.000 | ENR_6_PA_MOIN | 26DEC24 | |
| El Coco, Prohibited Zone, MRP-5 | 1:10.000 | ENR_6_PA_COCO | 18MAY23 | |
| Dominica, Prohibited Zone, MRP-6 | 1:10.000 | ENR_6_PA_DOMINICA | 18MAY23 | |
| Ochomogo, Prohibited Zone, MRP-7 | 1:10.000 | ENR_6_PA_OCHOMOGO | 18MAY23 | |
| Manolos, Prohibited Zone, MRP-8 | 1:10.000 | ENR_6_PA_MANOLOS | 18MAY23 | |
| Barranca, Prohibited Zone, MRP-9 | 1:10.000 | ENR_6_PA_BARRANCA | 18MAY23 | |
| Training Zones Index chart | 1:2.000.000 | ENR_6_TAIC | 18MAY23 | |
| E Training Zone | 1:110.000 | ENR_6_ETA | 18MAY23 | |
| W Training Zone | 1:210.000 | ENR_6_WTA | 18MAY23 |
|
Title of series |
Scale |
Name and/or number |
Price ($) |
Date |
| Training Zone No.4 | 1:80.000 | ENR_6_4TA | 18MAY23 | |
| Training Zone No.5 | 1:60.000 | ENR_6_5TA | 18MAY23 | |
| Radio Facilities Index Chart | 1:2.000.000 | ENR_6_NAC | 18MAY23 | |
| Aerodromes and Heliports Index Chart | 1:1.300.000 | AD_1.3 AHIC |
| |
| Aerodrome Chart ADC |
1:14.500 1:7.500 1:14.000 1:14.000 |
Juan Santamaría
Intl
.
AD-2.MROC ADC Tobías Bolaños Intl. AD-MRPV ADC Daniel Oduber Intl. AD-2.MRLB ADC Limón Intl. AD2.MRLM ADC |
30OCT25 26DEC24 30OCT25 26DEC24 | |
| Parking and docking Aircraft Chart |
1:6.500 1:5.000 |
Juan Santamaría
Intl
.
AD-2.MROC APC Daniel Oduber Intl. AD-2.MRLB APC |
30OCT25 18MAY23 | |
| Aerodrome Obstacle Chart Type A AOC |
1:10.000 1:225.000 |
Juan Santamaría
Intl
AD-2.MROC AOC TYPE A Daniel Oduber Intl. AD-2.MRLB AOC TYPE A |
30OCT25 18MAY23 | |
| Area Chart |
1:750.000 1:900.000 |
Juan Santamaría
Intl.
AD-2.MROC AC TMA COCO Daniel Oduber Intl. AD-2.MRLB AC TMA LIBERIA |
18MAY23 18MAY23 | |
|
Standard Departure Chart - Flight RNAV
Instruments (SID) |
Graphic Graphic Graphic Graphic Graphic 1:1.300.000 1:1.150.000 1:950.000 Graphic Graphic 1:900.000 1:1.100.000 |
Juan Santamaría
Intl.
AD-2.MROC SID POAS 4 AD-2.MROC SID PARAI 3 RWY 07 AD-2.MROC SID RAMON 4 AD_2.MROC SID ATENAS 4 AD_2.MROC SID NANJO AD_2.MROC SID TEJAR AD_2.MROC SID DOTAS Daniel Oduber Intl. AD-2.MRLB SID GUARDIA 2 RWY 25 AD-2.MRLB SID CAPULIN 2 RWY 07 AD-2.MRLB SID RNAV 1 RWY 07 NORTH AD-2.MRLB SID RNAV 1 RWY 07 SOUTH AD-2.MRLB SID RNAV 1 RWY 25 NORTH |
18MAY23 18MAY23 18MAY23 18MAY23 18MAY23 18MAY23 18MAY23 18MAY23 18MAY23 30OCT25 30OCT25 18MAY23 | |
|
Standard Arrival Chart - Flight RNAV
Instruments (STAR) |
1:1.000.000 1:1.300.000 1:900.000 1.650.000 1:650.000 1:800.000 |
Juan Santamaría
Intl.
AD-2.MROC STAR BARRA AD-2.MROC STAR CUARE AD-2.MROC STAR PARRI Daniel Oduber Intl. AD-2.MRLB STAR RNAV 1 RWY 07 NORTH AD-2.MRLB STAR RNAV 1 RWY 25 NORTH AD-2.MRLB STAR RNAV 1 RWY07-25 SOUTH |
18MAY23 18MAY23 18MAY23 18MAY23 18MAY23 18MAY23 | |
| Instrument Approach Chart IAC |
1:400.000 1:430.000 1.430.000 1:430.000 1:430.000 1:400.000 1:300.000 1:300.000 1:450.000 |
Juan Santamaría
Intl
AD-2.MROC IAC ILS RWY 07 AD-2.MROC IAC LOC Z RWY 07 AD-2.MROC IAC VOR DME RWY 07 AD_2.MROC IAC ILS Y RWY 07 AD-2.MROC IAC LOC Y RWY 07 AD-2.MROC IAC RNP RWY 07 AD-2.MROC IAC RNP W RWY 25 (AR) AD-2.MROC IAC RNP V RWY 25 (VPT) AD-2.MROC IAC RNP E RWY 25 (AR) |
18MAY23 18MAY23 18MAY23 18MAY23 18MAY23 18MAY23 18MAY23 18MAY23 18MAY23 |
|
Title of series |
Scale |
Name and/or number |
Price ($) |
Date |
| Instrument Approach Chart IAC |
1:300.000 1:350.000 1:330.000 1:380.000 1:380.000 |
Daniel Oduber
Intl.
AD-2.MRLB IAC ILS RWY 07 AD-2.MRLB IAC VOR-DME RWY 25 AD-2.MRLB IAC VOR DME RWY 07 AD-2.MRLB IAC RNP RWY 07 AD-2.MRLB IAC RNP RWY 25 |
18MAY23 18MAY23 18MAY23 18MAY23 18MAY23 | |
| Visual VAC Approach Chart |
Not to scale Graphic Not to scale Not to scale |
Juan Santamaría
Intl.
MR_AD-2.MROC VAC AD-2.MROC CYRUS VP RWY 25 MROC / MRPV Tobías Bolaños Intl. AD-2.MRPV VAC Daniel Oduber Intl. AD-2.MRLB VAC |
18MAY23 18MAY23 18MAY23 18MAY23 | |
| Traffic Pattern Chart |
Not to scale Not to scale 1:260.000 1:500.000 1:500.000 Not to scale Not to scale Not to scale Not to scale Not to scale Not to scale |
Juan Santamaría
Intl.
AD-2.MROC TP RWY 07 AD-2.MROC TP RWY 25 AD-2.MROC COCO TMA VFRR WEST SECTOR Tobías Bolaños Intl. AD-2.MRPV TP RWY 10 AD-2.MRPV TP RWY 28 AD-2.MRPV HTP RWY 10 AD-2.MRPV HTP RWY 28 Daniel Oduber Intl. AD-2.MRLB TP RWY 07 AD-2.MRLB TP RWY 25 Limón Intl. AD-2.MRLM TP RWY 15 AD-2.MRLM TP RWY 33 |
18MAY23 18MAY23 18MAY23 18MAY23 18MAY23 18MAY23 18MAY23 18MAY23 18MAY23 18MAY23 18MAY23 | |
| Fuel Dumping Area Chart |
Graphic 1:400.000 |
Juan Santamaría
Intl.
AD-2.MROC DFAC Daniel Oduber Intl. AD-2.MRLB DFAC |
18MAY23 26DEC24 | |
| Birds Concentration Chart |
1:13.000 1:13.000 |
Juan Santamaría
Intl.
AD-2.MROC BCC Daniel Oduber Intl. AD-2.MRLB BC |
30OCT25 18MAY23 | |
| Control Zone Chart |
Graphic Graphic |
Juan Santamaría
Intl.
AD-2.MROC AC CTR COCO Daniel Oduber Intl. AD-2.MRLB AC CTR LIBERIA |
18MAY23 18MAY23 | |
| Aerodrome Transit Zone |
Not to scale |
Tobías Bolaños
Intl.
AD-2.MRPV TADAC |
18MAY23 | |
| Declared Distances |
Not to scale Not to scale |
Juan Santamaría
Intl.
AD-2.MROC DDC Daniel Oduber Intl. AD-2.MRLB DD |
30OCT25 18MAY23 |
 | |||||||||||||||
| 6. Topographical charts | |||||||||||||||
| Topographical charts are available at: | |||||||||||||||
|
Instituto Geográfico Nacional
P.O.Box. 523-2010 San José Costa Rica Telephone: (506) 2202-0800 Web page: www.rnpdigital.com | |||||||||||||||
| 7. Corrections to charts not contained in the AIP | |||||||||||||||
| CHARTS | LOCATION | CORRECTIONS |
|
NIL
|